- Reaction score
- 13,850
- Points
- 1,260

Land subsidence is usually the culprit. A common cause of land subsidence is too much water being pumped out of underlying aquifers.Is that sea level rise or shore being consumed? If the Plymouth Rock isn't moving then two other possibilities remain - sand being washed away - a known phenomenon, or the ground under the shore is collapsing or tilting down. Also a possibility but that would apply to the Plymouth Rock as well.
So anywhere from 125 to 250 years away. A lot can and will change in that time. Consider how people were living and consuming 125 years ago.not sure what the flood map is actually but one can play with it online. In the article they mention 50cm and 1m
I agree. I think we should take all the money spent on expensive initiatives like solar or wind, that will never pay for themselves, and put it all into nuclear.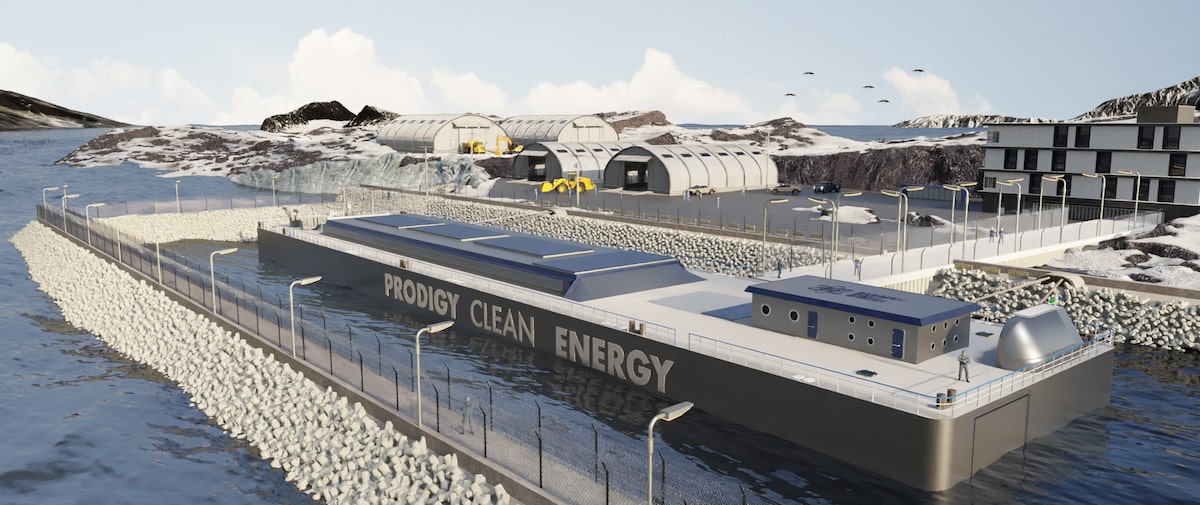
Can floating nuclear power plants help solve Northern Canada’s energy woes?
Diesel is the only way to keep the lights on in many remote Arctic towns. A new project wants to offer a greener option – but first it has to assuage safety and cost concerns and compete with renewableswww.theglobeandmail.com
View attachment 84915
I like it.
from the articleSo anywhere from 125 to 250 years away. A lot can and will change in that time. Consider how people were living and consuming 125 years ago.
50 centimetres is roughly 20 inches. That's a lot more than 4. I call bullsh!t. We know what the current rate of rise is because we measure it. We can't measure future rates of rise. Any guesses other than "more of the same" have approximately the status of "pulled out of someone's ass". It amazes me the sh!t some people will believe because they think climate experts know as much about climate as a plumber knows about plumbing.from the article
"The province’s own 2013 Sea Level Rise Adaptation Primer for regional managers recommends planning for sea level rise of about one metre by the end of the century, and 50 centimetres by 2050."
so its a planning initiative but 4mm/yr is just todays increase next decade it will be higher and the decade after that higher still. The level will continue to increase and the rate of increase as well until CO2/CO2eq is reduced to baseline
Hopefully floating nuke plants aren't as difficult to run as water treatment plants.Can floating nuclear power plants help solve Northern Canada’s energy woes?
Diesel is the only way to keep the lights on in many remote Arctic towns. A new project wants to offer a greener option – but first it has to assuage safety and cost concerns and compete with renewables
View attachment 84915
I like it.
well we know what it was yesterday and the day before too. I remember when it was 3mm/yr and when it was 2mm/yr50 centimetres is roughly 20 inches. That's a lot more than 4. I call bullsh!t. We know what the current rate of rise is because we measure it. We can't measure future rates of rise. Any guesses other than "more of the same" have approximately the status of "pulled out of someone's ass". It amazes me the sh!t some people will believe because they think climate experts know as much about climate as a plumber knows about plumbing.
I have been reading estimates of 3-5 mm per year for a couple of decades.well we know what it was yesterday and the day before too. I remember when it was 3mm/yr and when it was 2mm/yr
It’ll be a sad day indeed when the Jazz Hands no longer wave!I'll worry about flooding when Broadway is under water.
That's great, but it doesn't change the different numbers people have been putting out - which necessarily creates a range of reported values - or alter the facts that the data set is small and that extrapolations depend on the curve models.theres 30 yrs of satellite measurements.
itds not estimates its 10 yr back averages
what different numbers by what people?That's great, but it doesn't change the different numbers people have been putting out - which necessarily creates a range of reported values - or alter the facts that the data set is small and that extrapolations depend on the curve models.
there are dozens of sites globally that have a flood gauge that has been there for centuries. The circular openings in one of the bridges in Rome being one case in point. So floods are nothing new. The Seychelles were predicted to disappear under the Indian Ocean in the next few years but instead they have actually become larger. Evidently the land mass is rising up as much or more than the water level is. In Wales, Harlech castle has a lower level sally port that was used to bring supplies in by boat if the castle was besieged. It is now at least 2 km. from the sea. Much of the Netherlands is reclaimed from the sea and protected by seawalls. In short, I will continue to ignore the extraneous noise from those who insist that the sky is falling and simply encourage the introduction of simple preventive solutions such as walls when it becomes apparent that they are actually needed and not because someone's computer programme is making the forecast.what different numbers by what people?
Is that a bad thing?
I dont think the data set is small for modern sea level
there are dozens of sites globally that have a flood gauge that has been there for centuries. The circular openings in one of the bridges in Rome being one case in point. So floods are nothing new. The Seychelles were predicted to disappear under the Indian Ocean in the next few years but instead they have actually become larger. Evidently the land mass is rising up as much or more than the water level is. In Wales, Harlech castle has a lower level sally port that was used to bring supplies in by boat if the castle was besieged. It is now at least 2 km. from the sea. Much of the Netherlands is reclaimed from the sea and protected by seawalls. In short, I will continue to ignore the extraneous noise from those who insist that the sky is falling and simply encourage the introduction of simple preventive solutions such as walls when it becomes apparent that they are actually needed and not because someone's computer programme is making the forecast.

